Contents
Introduction
English version of an article first published in Polish on 3 August 2026. Read the Polish original.
Analytics tells you what happened: this many people came, this many left, this was the conversion rate. It does not tell you why. And that "why" is usually the only thing that actually leads to an improvement.
Microsoft Clarity fills exactly that gap. It records sessions, draws click and scroll maps, and catches moments of frustration. It does so with no traffic limit and no fees, which is unusual in this category of tools and needs explaining. That is where I will start.
What follows is practice from everyday work: how I filter recordings so as not to lose a day watching random videos, which metrics carry over to SEO, what the built-in Copilot can do, and where Clarity will let you down if you expect too much of it.
What you will learn:
- Why Microsoft gives Clarity away for free and what it gets in return
- How to filter session recordings so you do not lose a day watching random videos
- How to read scroll maps and when a heatmap lies
- Which frustration metrics have a real bearing on rankings in Google
- What the five Copilot features in Clarity can do and where not to trust them
- What a UX audit run on Clarity data looks like, step by step
What Clarity is and why it is free
Clarity is a behavioural analytics tool from Microsoft. Instead of numbers it shows behaviour: you can watch a recording of how a particular person moved around the site, see a map of the places that were clicked most often, and check how far down the page people get at all.
The thing that raises the most suspicion: it is free with no traffic limit. There is no premium plan that you get pushed into once you pass a session threshold, and no daily cap on recordings. The AI-based features cost nothing either.
This is not philanthropy, and it is better to say so plainly. Through Clarity, Microsoft collects a huge, aggregated set of data on how people behave on the web, and that data feeds its search and advertising products. So you pay not with money but with your share in that data set. For most companies it is a good trade, but it has to be covered in the privacy policy and made as a conscious decision, not in passing.
Setup in fifteen minutes
You create a project, get a code snippet and paste it into the <head> section. That is all. Alternatively, you add Clarity through Google Tag Manager or a plugin: ready-made integrations exist for WordPress and the popular e-commerce platforms.
One thing has to be done before data collection starts, not after: masking. Clarity lets you hide the contents of form fields and selected elements before the data even leaves the user's browser. It is worth going through the default settings and adjusting them to your site, instead of assuming that someone has thought about your basket or customer account for you.
The second configuration step, easy to forget: excluding from recording the pages where sensitive data may appear. The customer account, the payment steps, medical forms. The rule is simple: if something could appear on screen that you would not want to see in someone else's recording, that page should not be recorded.
Masking set up after a week of data collection will not undo what has already been recorded.
Session recordings: what not to watch
The most common mistake on first contact with Clarity: opening the recordings tab and starting to watch them one after another. After forty minutes you feel you have seen a lot, and your notes are empty, because most sessions are people who came, scrolled and left. That is normal behaviour, not a problem to solve.
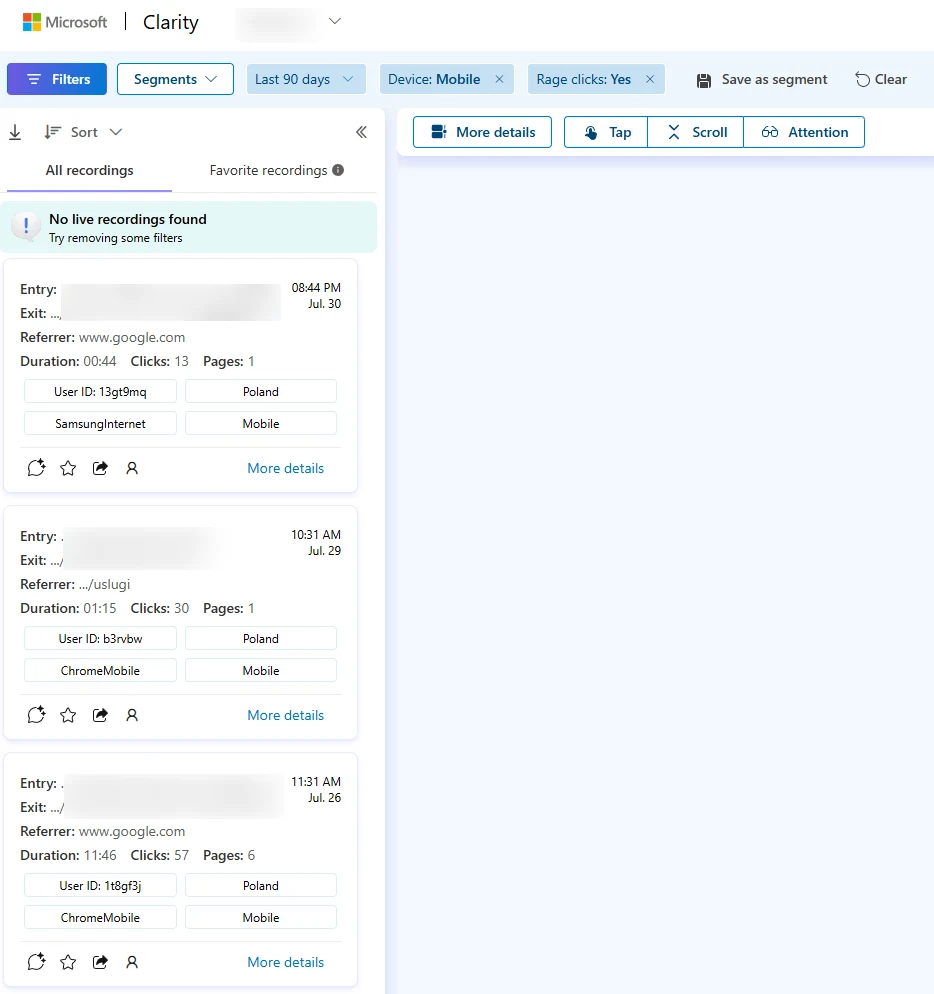
Recordings only make sense with a filter. The set I start with on every new project:
- Sessions with a rage click: someone clicked the same spot repeatedly. Almost always something there does not work, or looks clickable without being so.
- Sessions with a dead click: a click after which nothing happened.
- Long sessions without a conversion: someone was interested, spent time and still did not do what they came for. The most instructive category.
- Entries to a specific page: when you already know from Search Console or GA4 which page is going wrong.
- Mobile only: because a large share of problems exists only there, and you usually test on desktop.
Ten recordings chosen this way give you more than a hundred watched in sequence. During playback I turn on skipping inactivity and faster speed. A seven-minute session then comes down to a minute and a half without losing anything that matters.
Heatmaps and their traps
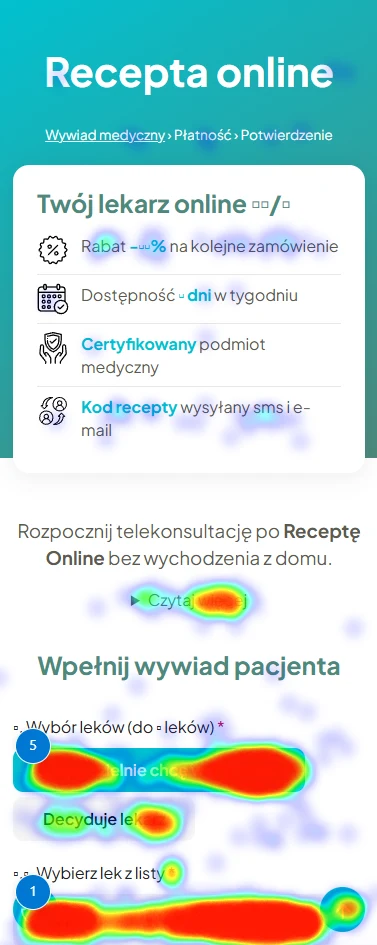
Clarity draws three kinds of maps. The click map shows where people click. The scroll map shows how far down they go. The area map aggregates clicks into larger sections, which can be easier to read on complex layouts.
I get the most out of the scroll map, and it is usually where I start. The point at which half of the visitors remain marks the real length of your page. Everything below it exists mainly for you. If the pricing section or the form sits beyond that line, you do not have a problem with the offer, you have a problem with the order.
Above the line
The hero and the offer reach all visitors. This is the only part of the page you know for certain has been seen.
The 50% line
The point at which half of the people remain. It marks the real length of your page: the actual one, not the one in the design.
Below the line
Pricing beyond this line is not a problem with the offer but with the order. Everything lower down exists mainly for you.
Three traps that are easy to fall into:
Averaging devices
A shared heatmap for mobile and desktop can hide a problem that exists on only one of them. Switch the view, do not look at the total.
Dynamic content
On pages with changing or personalised content, the map overlays clicks from different layouts. The result looks sensible and is worthless.
Sample too small
With a few dozen page views you see chance, not a pattern. Interpret a heatmap for a specific URL once it has a reasonable number of views.
Frustration signals
This is the heart of the tool and something you will not find in GA4. Clarity automatically detects four behaviours which indicate that something went wrong:
Rage clicks
A series of quick clicks in the same spot. A person clicks several times because nothing happens. Usually the element looks clickable but is not, or it responds with a delay.
Dead clicks
A click after which nothing happened. Favourite spots: images that look like buttons, section headings, icons with no action.
Excessive scrolling
Nervous scrolling up and down. Someone is looking for information that is not where they expected it, most often the price, contact details or the delivery cost.
Quick backs
Landing on a page and going straight back. For SEO this is the most valuable of the four signals. I return to it in the next section.
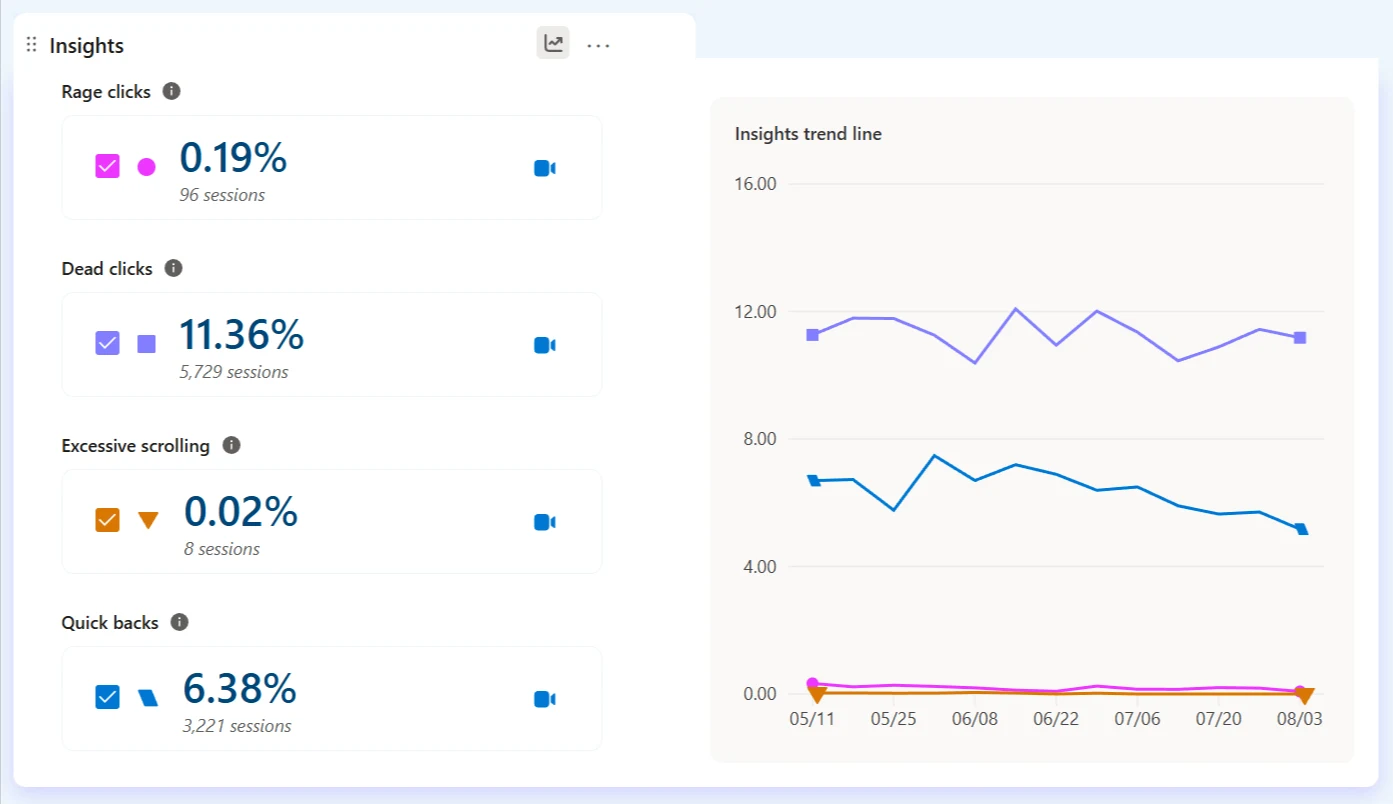
The value of these metrics is that they turn a vague "the page converts poorly" into a specific URL and a specific element to look at. You go from the metric to the recording in one click and see what happened.
Signal
URL
Recording
Rage clicks
0.19% of sessions
/services/quote
38 sessions with this signal
Dead clicks
11.36% of sessions
/contact
412 sessions with this signal
What SEO gets out of it
Clarity is not an SEO tool, and installing it will not move your rankings by a millimetre. It does, however, show things you will not see in Search Console and that carry over directly to how Google judges the match between a page and a query.
Quick backs as a sign of mismatched intent
If a page ranks for a query and people land on it and go back after a few seconds, you have hard information: the content does not answer what they were looking for. Search Console will then show you only a falling CTR or position, with no explanation. Clarity tells you on which specific page this is happening and lets you watch those sessions.
This is the most valuable piece of SEO information in the whole tool, because it touches the thing that is hardest to diagnose from the outside: the gap between what people come for and what they get.
Scroll depth and content length
You have written an extensive guide, and the scroll map shows that eighty per cent of readers never reach the section with the answer. The solution is not to shorten the text but to move the answer to the top. It is exactly the same principle that decides whether a model cites your content in an AI answer. I develop it in a separate article on the BLUF method.
Dead clicks in internal linking
Dead clicks on images and headings are a sign that people want to go further at a point where you gave them no link. Each such spot is a lost step deeper into the site, both for the user and for the crawler, which learns the structure of your site from internal linking.
Rage clicks and performance
Clusters of rage clicks very often coincide with elements that load too slowly or respond with a delay. It is the same area that Core Web Vitals measure, only seen from the human side instead of from the chart side. If you are looking for the technical causes, I have gathered the most common ones in my piece on technical SEO mistakes.
Copilot: five AI features
Microsoft has built a layer based on language models into Clarity. You switch it on in the project settings, in the Copilot section, and like the rest of the tool it costs nothing. It consists of five features:
Questions about the project asked in natural language. Instead of clicking through filters, you ask directly and get a summary.
A summary of a single recording. Instead of watching seven minutes of a session, you read a few sentences about what the user did.
The same, but for many recordings at once. You look for a pattern in a group of sessions instead of drawing conclusions from a single case.
A synthesis of the heatmaps for a specific page, covering all three device types at the same time.
Combines advertising campaign metrics with user behaviour after the click: what happens on the landing page, not only in the ads dashboard.
In practice, the one I reach for most often is Grouped Session Insights. I pick twenty sessions that meet some condition, for example campaign visits that did not end in a conversion, and I get a summary of what they have in common. It does not replace watching a few recordings, but it greatly shortens the path to a hypothesis.
An honest caveat
Microsoft itself warns in the documentation that generative models can misinterpret data or generate false information, and it adds a button next to the summaries for reporting mistakes. That is rare candour for vendor material and worth taking seriously.
On top of that comes a limitation that no documentation will list: the model summarises what it sees in the data, but it does not know your business. It does not know that the third step of the form is the one you care about most, or that traffic from one campaign is worth ten times more than traffic from another. So I treat the summaries like a note from an intern who has watched the recordings: useful, but in need of checking.
What it does for you
- Summarises a recording. It turns seven minutes of watching into a few sentences.
- Merges the maps. One page, all device types in a single summary.
- Groups sessions. Twenty visits that meet a condition and one sentence on what they have in common.
What it does not know about you
- Which step counts. It does not know that the third screen of the form is the one you care about.
- What the traffic is worth. A session from one campaign and from another weigh the same to it.
- When it is wrong. Microsoft itself warns that the model can make things up, hence the button for reporting mistakes.
Clarity and Google Analytics
This question comes up with every setup, so I will answer it plainly: these tools neither exclude nor replace each other. They work on different layers of the same problem.
GA4 answers "how many and from where"
Traffic volume, sources, conversion paths, revenue. Quantitative data on which you make budget decisions.
Clarity answers "why"
What happens on the page between arrival and exit. Qualitative data on which you make design decisions.
Clarity can be connected to GA4, which lets you carry segments from analytics over to recordings and watch the sessions of a specific group of users. My standard way of working looks like this: in GA4 or Search Console I find where the problem is, and in Clarity I check what it consists of. The reverse order ends in watching random recordings.
A UX audit built on Clarity
Everything above adds up to the process I run for clients. It looks like this:
- 01Data collection. A week at minimum, two with lower traffic, so that the heatmaps have something to be built from and the recordings also cover a weekend.
- 02Choosing the pages. The intersection of two lists: the pages with the most traffic and the pages with the worst frustration metrics. That is where the money is.
- 03Heatmaps, separately per device. The scroll map first, the click map second.
- 04Filtered recordings. Rage clicks and dead clicks on the chosen pages. This is where I confirm or reject the hypotheses from step three.
- 05A prioritised list of changes. Every item with evidence: a specific heatmap or recording. Without that, a conversation about changes turns into an exchange of opinions.
- 06Measurement after implementation. The same metrics, the same range of weekdays. Without that you do not know whether it helped.
Step five is the one that changes the nature of the whole conversation with the client. "I think this button should be higher up" is an opinion. "Sixty per cent of mobile users never see it, here is the map" is an argument.
When it is worth handing this over
Clarity is free and anyone can install it. The bottleneck is not the tool but the time and the experience in reading this data. If you would prefer to get a ready list of changes with evidence instead of learning interpretation from scratch, that is exactly what the UX audit I run is.
What Clarity will not do
The tool has real limits, and it is better to know them in advance than to discover them along the way.
- It will not tell you why someone wanted something. You see behaviour, not motivation. Only a person can answer "why didn't you buy", in a survey, an interview or a conversation with customer service.
- It will not replace A/B tests. It will show that something is a problem. It will not prove that your fix is better than another one.
- It will not replace analytics. There is no full attribution model and no revenue data, so it is not enough as your only source.
- It will not relieve you of your GDPR obligations. Masking, exclusions and a mention in the privacy policy are your responsibility, not a default setting.
- It will not show what it cannot see. Ad blockers and some privacy extensions can block the script, so the picture is incomplete by definition. Look for proportions and patterns in this data, not absolute numbers.
There is one more layer of Clarity that I am deliberately leaving alone here: the reports showing how AI assistants see your site and for which queries they cite you. Microsoft has expanded it considerably over the past year and it deserves a separate piece, especially as it gives away for free what competing tools charge for. In the meantime, I have written about measuring AI visibility in the context of Bing Webmaster Tools and the reports in Search Console.
FAQ: common questions
Is Microsoft Clarity really free?
Yes, entirely and with no traffic limit. There is no paid plan that you get pushed into once you pass a session threshold. The Copilot features cost nothing either. Microsoft is not doing this out of philanthropy: in return it collects aggregated data on how users behave on the web, which feeds its search and advertising products. It is a fair exchange, but it is worth calling it what it is and covering it in your privacy policy.
Does Clarity slow the site down?
The script loads asynchronously, so it does not block content rendering, and in a typical installation it does not show up in Core Web Vitals. It is still one more external resource to download, though. If your site already has a dozen or more third-party scripts, each additional one costs something. Practical advice: after setting it up, measure the page before and after in PageSpeed Insights instead of taking anyone at their word, mine included.
Is Clarity GDPR-compliant?
The tool itself provides mechanisms that let you use it in line with the rules, above all content masking, which hides the contents of form fields and selected elements before the data leaves the browser. Compliance does not come from the tool, though, but from how you configure it. You need to: set up masking before data collection starts, name Clarity and Microsoft in your privacy policy as a tool and a processor, and hook the script into your consent mechanism if you use one. Check the masking configuration separately on pages with sensitive data: the basket, the customer account, a medical form.
Clarity or Hotjar: which one to choose?
For most Polish companies, Clarity, and not because of the price but because of the limits. Free Hotjar caps the number of sessions recorded per day, which on a site with real traffic means you see a slice and have no say in which one. Clarity records without a limit, so the filters work on the full set, and filtering is the most important part of this job. Hotjar, on the other hand, has a stronger research layer: on-site surveys, tests, participant recruitment. If you need to ask users directly and not only observe them, then paying extra makes sense.
Will Clarity replace Google Analytics?
No, and that is not what it is for. GA4 answers quantitative questions: how many people came, from where, how many bought, how much it was worth. Clarity answers a qualitative question: why those who did not buy did not do so. These tools work on different layers and work best together. In GA4 you find the page where something is going wrong, in Clarity you watch what exactly. Clarity has no full attribution model and no revenue data, so it would not be enough as your only data source.
How much traffic do you need for Clarity data to mean anything?
For session recordings, literally a few dozen visits are enough. One well-chosen session can show a broken form, and that is complete information in itself. Heatmaps are a different story: at a few hundred page views of a given page the click map starts to be readable, below a hundred it mostly shows chance. The practical rule I follow: I watch recordings from day one, and I interpret heatmaps only once there is a reasonable sample for a specific URL, not for the whole site.
Can recording be switched off on selected pages?
Yes, and for some types of pages it is not an option but an obligation. Clarity lets you exclude specific URLs from recording and mask selected elements on the pages you do record. The standard candidates for exclusion are customer accounts, pages with medical or financial data, and the payment steps where card details appear on screen. The rule is simple: if something could appear on screen that you would not want to see in someone else's recording, that page should not be recorded.
Does Clarity improve rankings in Google?
Not directly. It is not an SEO tool, and installing it will not change anything in the results. Indirectly, though, it can be one of the best-value tools in the whole kit, because it shows things you cannot see in Search Console: that users arriving from a query go back after a few seconds, that they never reach the section with the answer, that they click an element that looks like a button and is not one. Fixing these things improves how well the page matches the intent, and that does carry over to results.
Worth remembering
- Clarity is free with no traffic limit. Microsoft earns from aggregated behavioural data, not from a subscription.
- You do not watch recordings one after another. Ten recordings filtered by rage click give you more than a hundred random ones.
- Quick backs are the most valuable SEO signal in the whole tool: they show pages that rank for a query but do not answer the intent.
- Read the scroll map separately for mobile and desktop. An averaged heatmap can hide a problem that exists on only one device.
- Copilot summarises the data, but it does not know your business. Microsoft itself warns in the documentation that generative models can be wrong.
- Masking is set before data collection starts, not after. Clarity also has to be named in your privacy policy.
Summary
Clarity is not a tool that will fix anything for you. It is a tool that stops letting you guess, and in work on a website guessing is what costs the most.
The greatest value of this tool lies not in what it shows, but in the fact that it ends discussions based on opinions.
If you do not have it yet, start with the simplest thing: install it, set up masking, wait a week and watch ten recordings filtered by rage click. You will almost always find something in them that you had no idea about.
Sources and materials
Vendor documentation and materials on which I base the description of the features:
Want to know what is breaking your site?
I will run a UX audit on Clarity data and hand over a prioritised list of changes, each backed by a specific heatmap or recording.
See the UX auditHow this text was written
I will not pretend it was written entirely by hand, by candlelight. For the research, the proofreading and the code of this page I used a language model. It is a good tool for digging through documentation and catching the typos you no longer see on the third read of your own text. The English version was also prepared with a model, from my Polish original.
What the model did not do: it did not choose the topic, form the arguments or decide what this data means for your site. That stays with me, as does the last word on what goes into the text and what comes out of it.
Where the model helped
- digging through sources and organising data
- proofreading and the English version of the text
- code, page layout and infographics
What stays with me
- the choice of topic and what is worth saying about it
- the arguments, the reading of the data and the conclusions
- fact-checking and the decision on what goes into the text

Written by
Sebastian Baryś
Freelance SEO specialist · Częstochowa, Poland, and remote
I started when nobody had dreamt of Core Web Vitals and rankings were checked by hand. Today I work on making companies visible not only in Google, but wherever people ask questions. I write only about things I check myself in client projects.